
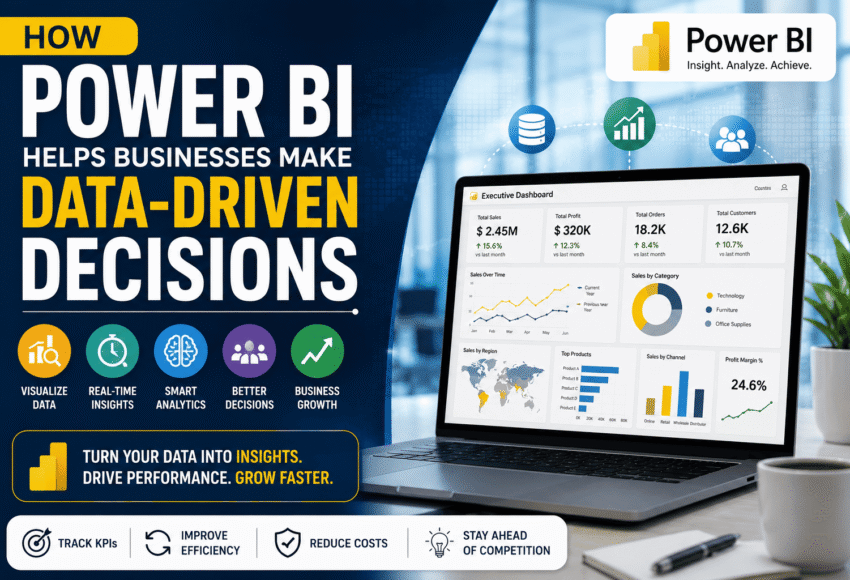
How Power BI Helps Businesses Make Data-Driven Decisions
In today’s digital economy, businesses generate massive amounts of data every day—from sales and customer interactions to inventory, marketing campaigns, and financial transactions. However, raw data alone doesn’t create business value. Organizations need tools that transform complex information into actionable insights.
Microsoft Power BI is one of the world’s leading Business Intelligence (BI) platforms, enabling businesses to visualize data, monitor key performance indicators (KPIs), uncover trends, and make faster, smarter decisions. Whether you’re a startup, small business, or global enterprise, Power BI empowers teams with interactive dashboards, real-time reporting, and AI-powered analytics.
This comprehensive guide explores how Power BI supports data-driven decision-making, its key features, business benefits, industry applications, and why it’s an essential skill for professionals in 2026.
What is Power BI?
Power BI is Microsoft’s Business Intelligence and Data Analytics platform that transforms raw data into interactive reports and dashboards. It connects to multiple data sources, processes large datasets, and presents insights through visualizations that help organizations make informed business decisions.
Power BI enables users to:
- Analyze business performance
- Monitor KPIs
- Automate reports
- Visualize trends
- Forecast outcomes
- Share dashboards securely
- Collaborate across teams
What Does Data-Driven Decision-Making Mean?
Data-driven decision-making (DDDM) is the practice of using accurate, real-time data instead of assumptions or intuition to guide business strategies.
Organizations use data to answer questions like:
- Which products generate the highest profit?
- Which marketing campaigns deliver the best ROI?
- Where are operational inefficiencies?
- Which customers are likely to churn?
- What inventory should be reordered?
- Which regions drive the most sales?
Power BI helps answer these questions quickly through visual reports and analytics.
Why Businesses Need Power BI
Traditional reporting methods often involve manual Excel sheets, static charts, and time-consuming data consolidation.
Power BI eliminates these challenges by offering:
- Automated reporting
- Interactive dashboards
- Live data updates
- AI-powered insights
- Easy collaboration
- Cloud accessibility
- Enterprise-grade security
This enables decision-makers to act faster and with greater confidence.
Key Features of Power BI
1. Interactive Dashboards
Power BI provides dynamic dashboards that allow users to:
- Drill into detailed data
- Filter reports instantly
- Compare business metrics
- Track performance in real time
Instead of reviewing multiple spreadsheets, executives can view all critical KPIs on a single dashboard.
2. Real-Time Data Monitoring
Power BI connects directly to business systems, allowing organizations to monitor live data such as:
- Sales performance
- Website traffic
- Customer orders
- Manufacturing output
- Financial transactions
- Inventory levels
Real-time reporting enables faster decision-making and quicker responses to changing business conditions.
3. Data Visualization
Power BI transforms complex datasets into easy-to-understand visuals, including:
- Bar Charts
- Line Charts
- Pie Charts
- Maps
- Heat Maps
- KPI Cards
- Funnel Charts
- Waterfall Charts
- Gauge Charts
- Scatter Plots
These visualizations make business insights accessible to both technical and non-technical users.
4. AI-Powered Analytics
Power BI includes built-in AI capabilities such as:
- Natural Language Queries
- Smart Narratives
- AI Visuals
- Automated Insights
- Predictive Analytics
- Trend Detection
- Anomaly Detection
These features help users uncover hidden patterns and make proactive business decisions.
5. Data Integration
Power BI connects with hundreds of data sources, including:
- Microsoft Excel
- SQL Server
- Azure
- Oracle
- MySQL
- PostgreSQL
- SharePoint
- Salesforce
- Google Analytics
- SAP
- APIs
- Cloud databases
This creates a unified view of business operations without manual data consolidation.
How Power BI Improves Business Decision-Making
Better Visibility
Executives gain a comprehensive view of organizational performance through centralized dashboards.
Benefits include:
- Faster reporting
- Better transparency
- Improved communication
- Enhanced collaboration
Faster Decision-Making
Manual reporting often takes hours or days.
Power BI automates data refreshes, allowing managers to:
- Identify issues quickly
- Respond to market changes
- Monitor business health in real time
Improved Accuracy
Automation reduces human errors caused by manual spreadsheet updates.
Power BI ensures:
- Consistent calculations
- Reliable metrics
- Standardized reporting
- Accurate forecasts
KPI Tracking
Businesses can monitor critical Key Performance Indicators (KPIs), such as:
- Revenue
- Profit Margin
- Sales Growth
- Customer Satisfaction
- Inventory Turnover
- Employee Productivity
- Marketing ROI
- Customer Acquisition Cost
Continuous KPI monitoring supports informed strategic decisions.
Trend Analysis
Power BI helps organizations identify:
- Seasonal demand
- Customer buying behavior
- Sales trends
- Revenue growth
- Market opportunities
Trend analysis enables better forecasting and planning.
Business Use Cases of Power BI
Sales Analytics
Sales teams use Power BI to monitor:
- Monthly revenue
- Regional performance
- Top-selling products
- Sales targets
- Customer acquisition
Finance & Accounting
Finance departments leverage Power BI for:
- Budget tracking
- Profit and loss analysis
- Cash flow reporting
- Expense monitoring
- Financial forecasting
Human Resources (HR)
HR professionals analyze:
- Employee performance
- Attendance
- Recruitment metrics
- Employee turnover
- Training effectiveness
Marketing Analytics
Marketing teams track:
- Campaign performance
- Lead generation
- Website traffic
- Conversion rates
- Customer engagement
Supply Chain Management
Power BI helps monitor:
- Inventory levels
- Warehouse performance
- Delivery timelines
- Vendor performance
- Procurement costs
Customer Service
Support teams analyze:
- Customer satisfaction scores
- Response times
- Complaint trends
- Resolution rates
- Service quality
Industries Using Power BI
Power BI is widely adopted across industries, including:
- Information Technology (IT)
- Banking & Financial Services
- Healthcare
- Manufacturing
- Retail & E-commerce
- Telecommunications
- Insurance
- Logistics & Supply Chain
- Education
- Pharmaceuticals
- Hospitality
- Government
- Real Estate
- Consulting
- Media & Entertainment
Benefits of Power BI for Businesses
Improved Productivity
Automated dashboards reduce manual reporting, allowing employees to focus on analysis rather than data preparation.
Better Collaboration
Teams can securely share reports across departments, ensuring everyone works from the same data.
Cost Savings
Power BI reduces reporting costs through automation and minimizes reliance on multiple reporting tools.
Increased Profitability
Data-driven insights help optimize pricing, inventory, marketing, and operations, leading to higher profitability.
Enhanced Customer Experience
Businesses gain a deeper understanding of customer behavior, enabling personalized services and improved retention.
Power BI and Artificial Intelligence
Power BI integrates AI to make analytics more accessible.
AI-powered capabilities include:
- Smart Insights
- Predictive Analytics
- AI Visuals
- Copilot Assistance
- Natural Language Queries
- Machine Learning Integration
These features enable users to ask questions in plain language and receive instant visual answers.
Why Professionals Should Learn Power BI
Power BI has become one of the most sought-after skills in analytics and business intelligence.
Professionals with Power BI expertise can pursue roles such as:
- Power BI Developer
- Data Analyst
- Business Intelligence Analyst
- Reporting Analyst
- Business Analyst
- Financial Analyst
- Analytics Consultant
- Data Visualization Specialist
Future of Power BI in 2026
The future of Power BI is driven by advancements in AI and cloud technologies, including:
- Microsoft Fabric integration
- Enhanced Copilot capabilities
- Real-time analytics
- Advanced predictive modeling
- Improved collaboration tools
- Greater automation
- Expanded cloud connectivity
As organizations increasingly embrace digital transformation, Power BI will remain a cornerstone of business intelligence strategies.
Best Practices for Implementing Power BI
- Define clear business objectives.
- Connect reliable and clean data sources.
- Design user-friendly dashboards.
- Focus on meaningful KPIs.
- Automate data refresh schedules.
- Implement role-based security.
- Train employees on dashboard usage.
- Continuously monitor and optimize reports.
Frequently Asked Questions (FAQs)
What is Power BI used for?
Power BI is used to analyze data, create interactive dashboards, automate reporting, monitor KPIs, and support data-driven business decisions.
How does Power BI help businesses?
Power BI helps businesses by transforming raw data into actionable insights, enabling real-time monitoring, improving operational efficiency, reducing manual reporting, and supporting strategic decision-making.
Is Power BI suitable for small businesses?
Yes. Power BI is scalable and cost-effective, making it an excellent choice for startups, small businesses, and large enterprises alike.
Does Power BI require coding?
No. Basic Power BI reporting requires little to no coding. However, learning DAX and SQL enhances advanced reporting and analytics capabilities.
Which industries benefit most from Power BI?
Industries such as finance, healthcare, retail, manufacturing, logistics, IT, education, telecommunications, and government all benefit significantly from Power BI’s analytics capabilities.
Is Power BI a good career skill in 2026?
Absolutely. Power BI continues to be one of the most in-demand Business Intelligence tools, creating opportunities in data analytics, business intelligence, consulting, and management.
Conclusion
Power BI has transformed the way businesses analyze information and make strategic decisions. By combining interactive dashboards, real-time reporting, AI-powered analytics, and seamless integration with multiple data sources, it empowers organizations to replace guesswork with evidence-based decision-making.
Whether you’re a business owner seeking operational efficiency or a professional aiming to build a career in analytics, Power BI offers immense value. As data continues to shape competitive advantage in 2026 and beyond, mastering Power BI is not just a technical skill—it’s a strategic investment in smarter business outcomes and long-term career growth



Leave a Comment